Add a Power BI View to Dynamics 365
You embed a Power BI view by referencing the Power BI element id. If you, as recommended, embed views from a group workspace you also need to reference the group id.
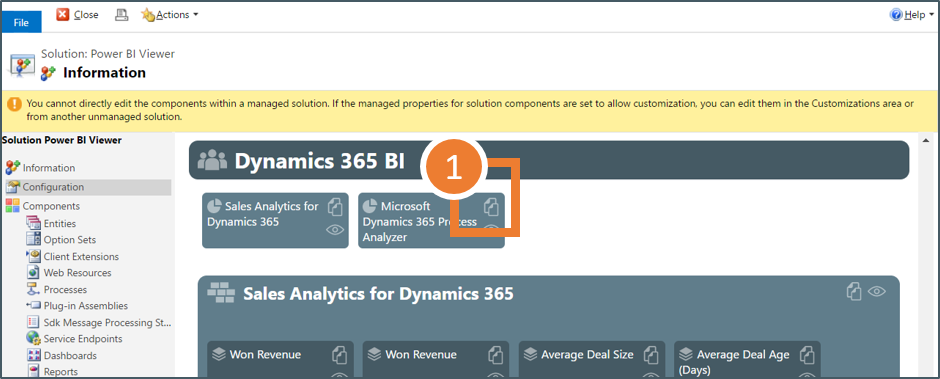
The easiest approach to find elements you have access to and the required CRM configuration is by going to the solution configuration page.
The configuration page lists available reports, dashboards and tiles. Both those you have access to through your personal workspace and those through group membership(s). Click preview to see how the view looks inside Dynamics 365 (note: previews are shown inside the configuration page).

On-premise and using Edge? The security in Edge prevents communication between the webresource and the authentication popup if they are not in the same security zone You have two options; 1: Add “https://login.microsoftonline.com” to the same zone as your CRM instance, or 2: Disable protected mode on the security zone. This must be changed for all users.
Steps
The following example uses a report, but the exact same procedure applies to dashboard and tiles.
-
When you have found the report you want to use you need to copy the configuration values. Click the clipboard icon to copy the configuration values to the clipboard.
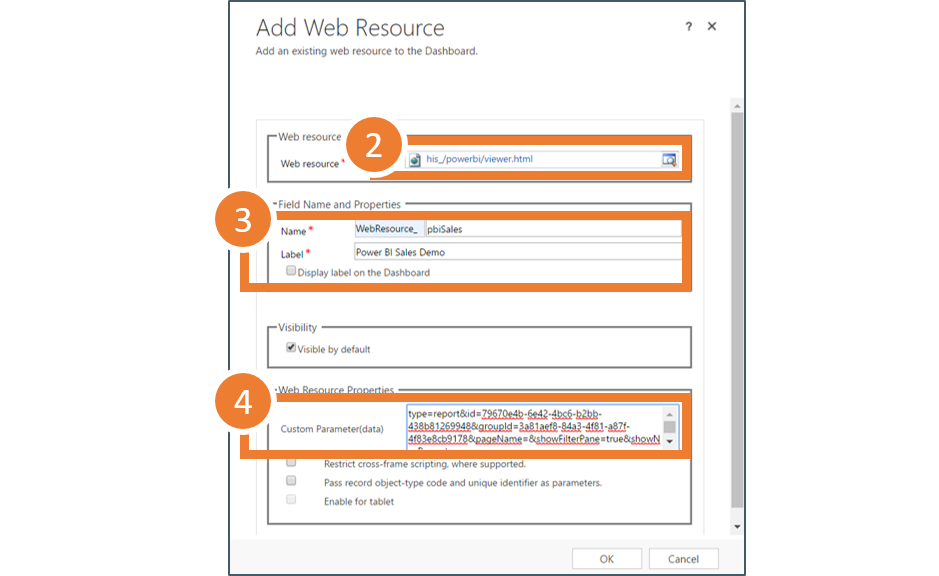
- Next create a new dashboard and add the web resource named ‘his_/powerbi/viewer.html’.
- Give the resource a meaningful name and label.
-
Paste the configuration from step 1 into ‘Custom parameter (data)’.
- Save and publish the dashboard.
- You are done! The result should be similar to the image below.

The parameter constructs are:
Remove groupid including brackets when embedding a personal view.
Report
type=report&id=<reportid>[&groupId=<groupId>]&pageName=[initialPage]&showFilterPane=true&showNavPane=true
Single Visual
From v1.1 it is possible to display a single visual from a report page (effectively hiding all other visuals on the page). The configuration is similar to full reports, with a few minor differences:
- Set
type=visual - You should always specify pageName
- Name of the visual must be added as a new parameter called
visualName.
type=visual&id=<reportid>[&groupId=<groupId>]&pageName=<pageName>&visualName=<visualName>
The visual name is not the same as the title and finding it is a bit of a hassle. To assist crm-powerbi-viewer logs the visual names to the dev console when you preview a report (see image below - click for larger view).

You find the dev console by hitting [F12] when you have the configuration page in focus. Visual title and type are also logged to help you identify the correct visual.
Dashboard
type=dashboard&id=<dashboardid>[&groupId=<groupId>]
Tile
type=tile&id=<tileid>&dashboardId=<dashboardid>[&groupId=<groupId>]